This is an old revision of the document!
Undecoded Window
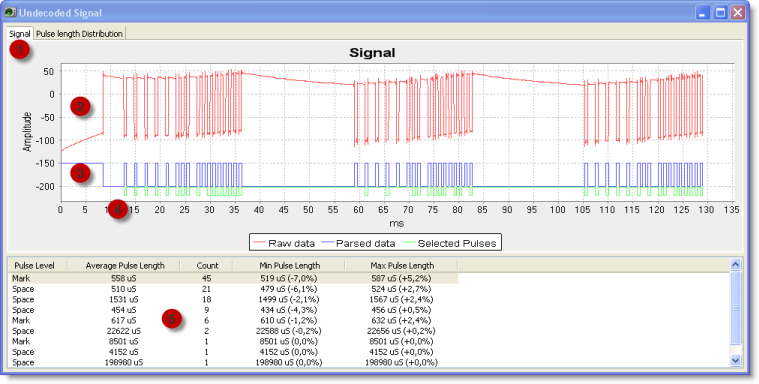
The undecoded window is the heart of the analyzer. Here you can see the raw undecoded signal and analyze the pulses. The Windows is opened by double clicking on a raw message line

| Nr | Explanation |
|---|---|
| 1 | Signal folder selected. In this view you see the signal time line |
| 2 | The analog signal received from the audio device (red line). If the CUL device is used, this is not available |
| 3 | The pulse interpretation of the analog signal (blue line). The flank detector uses the flank settings to detect pulses in the analog signal. The result of that analysis is presented here |
| 4 | Pulses matching the selected pulse group (green line). Select a pulse length group below to see which pulses in the signal matches that length |
| 5 | Pulse group window |
Pulse Groups
To help analyzing new protocols, the received pulses are grouped according to pulse length. Pulses which are within 10% of each other in length are grouped, and the groups are sorted according to the number of pulses in each group. When a group is selected, all pulses within that group are marked with a green line in the graph.
Zoom
You can zoom in on any part of the graph by selecting the upper left corner of the area you want to zoom in on, hold the left mouse button pressed and drag the cursor to the lower left corner of the area and then releasing the button:

To zoom back out again, press the left mouse button anywhere in the graph and move left and up and then release. You may also right click in the graph and a menu with zoom options will appear.
